Understanding WiFi Channels: WiFi operates on different channels within the 2.4 GHz and 5 GHz frequency bands. These channels serve as virtual lanes for data transmission. However, improper channel selection can lead to interference and congestion, resulting in slower speeds and reduced network performance. That’s where the Channel Graph feature comes in.
Table of Contents
ToggleThe Power of Channel Graph
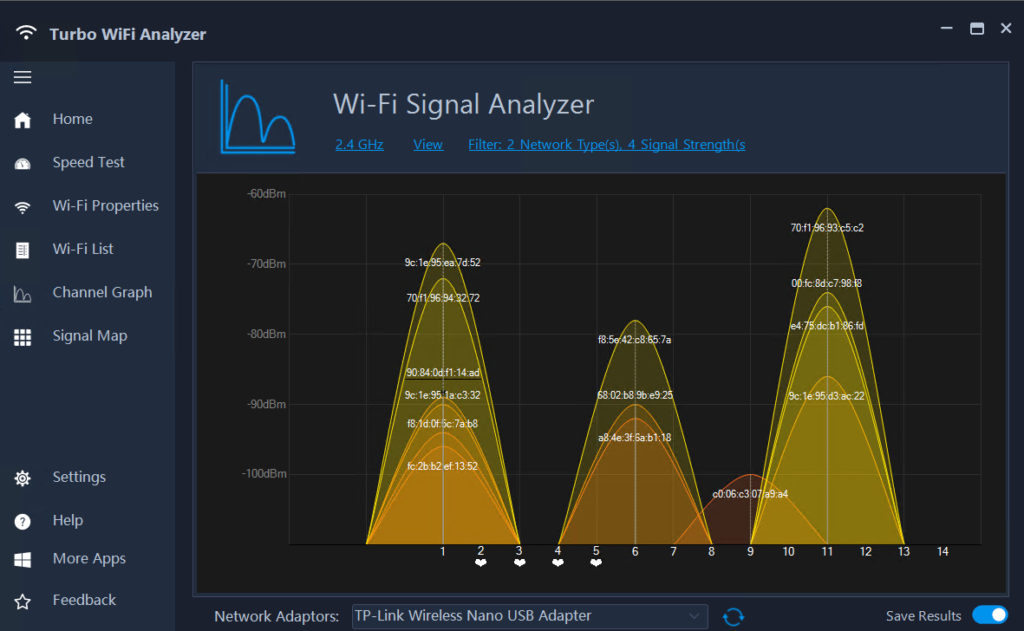
The Channel Graph feature within the Turbo WiFi Analyzer app is a powerful tool for analyzing and optimizing WiFi speed. It provides a visual representation of WiFi channel utilization, allowing you to identify which channels are heavily congested and which ones are underutilized. By understanding channel utilization patterns, you can make informed decisions to improve your WiFi speed.
Analyzing Channel Utilization
Using the Channel Graph feature is simple. Open the Turbo WiFi Analyzer app and navigate to the Channel Graph section. The graph will display the signal strength and utilization of each WiFi channel in your vicinity. Analyze the graph to identify channels with lower utilization or less interference, as these present an opportunity for potential performance enhancement. Turbo WiFi Analyzer offers Channel Recommendations based on real time data and denotes preferred channels with a heart icon as seen in the screenshots above
Optimizing WiFi Speed
Armed with the insights from the Channel Graph, you can take steps to optimize your WiFi speed. Start by selecting the least congested channels for your network. This can be done by accessing your router settings and manually configuring the channel. Additionally, consider adjusting other router settings such as transmit power and channel width to further optimize performance. By minimizing interference from neighboring networks and selecting the optimal channel, you can significantly improve your WiFi speed.


